A Practical Guide to Selecting the Right KPI for Digital Marketing
Master kpi for digital marketing with this concise guide to essential KPIs, metrics, formulas, and frameworks that drive growth.
Oct 26, 2025
generated

Last Updated: October 14, 2023 By Haralds Gabrans Zukovs, B2B Growth Strategist
Digital marketing KPIs (Key Performance Indicators) are not just abstract numbers on a dashboard. They are the specific, measurable signposts that tell you precisely how well your online strategy is achieving critical business objectives. The core challenge is moving beyond collecting mountains of data and instead focusing on the metrics directly wired to outcomes like revenue growth, lead generation, and customer value. This guide provides a framework for selecting, tracking, and acting on the KPIs that truly matter.
Key Takeaways (TL;DR)
KPIs vs. Metrics: A metric is any data point (e.g., website traffic). A KPI is a metric tied directly to a business goal (e.g., Visitor-to-Lead Conversion Rate) that demands action.
Funnel Alignment is Crucial: Different KPIs are needed for each stage of the marketing funnel. Top-of-funnel (ToFu) focuses on reach (Organic Traffic), middle-of-funnel (MoFu) on engagement (MQL Rate), and bottom-of-funnel (BoFu) on revenue (Customer Acquisition Cost).
Start with the Goal: The most effective way to choose KPIs is to define a clear business objective (e.g., "Increase Q3 revenue by 15%") and work backward to identify the marketing metrics that directly influence that outcome.
Channel-Specific KPIs: Each marketing channel (SEO, PPC, Social Media, Email) has unique performance indicators. Tracking these allows for granular budget optimization and strategy refinement.
Actionable Dashboards: A well-designed dashboard tells a story, connecting marketing activities to business results. It should include an executive summary, a funnel performance view, and a channel performance breakdown.
Moving Beyond Vanity Metrics to Drive Real Growth
It’s incredibly easy to get swamped by a sea of numbers in digital marketing. We see likes, shares, impressions, and follower counts climbing, creating a comforting illusion of progress. But here’s the critical question: do those figures actually move the needle for your business?
This is where you must draw a hard line between a simple metric and a true Key Performance Indicator (KPI).
Think of it this way: vanity metrics are like the speedometer in a car. It feels great to see you're going fast, but it doesn't tell you if you're on the right road. Actionable KPIs are the GPS, giving you turn-by-turn directions to your actual destination—sustainable business growth.
The Philosophy of Actionable KPIs
To make a tangible impact, you must adopt a results-first mindset. This means every marketing activity, from a blog post to a paid ad campaign, must connect back to a core business goal. For most B2B SaaS and tech companies, that almost always boils down to revenue, Sales-Qualified Leads (SQLs), and Customer Lifetime Value (CLV).
A KPI is only worth tracking if it forces you to ask "what's next?" and inspires you to take action.
Knowing you had 10,000 website visitors last month is a metric. Discovering that only 0.5% of them converted into qualified leads? That’s a KPI. It immediately forces you to question your website’s conversion pathways, the clarity of your calls-to-action, and the overall user experience. This pivot in thinking separates a cost-center marketing team from a revenue-driving one.
To clarify the distinction, here’s a quick comparison of what separates a feel-good number from a metric that drives strategy.
Actionable KPIs vs. Vanity Metrics At a Glance
Business Goal | Actionable KPI | Common Vanity Metric |
|---|---|---|
Generate high-quality leads | Lead-to-SQL Conversion Rate | Total website traffic |
Increase sales pipeline | Marketing-Sourced Pipeline Value | Number of social media followers |
Improve content ROI | Conversion Rate by Content Asset | Blog page views or social shares |
Reduce sales cycle length | Average Time to Customer Conversion | Email open rates |
Maximise customer value | Customer Lifetime Value (CLV) | Total number of email subscribers |
Focusing on the KPIs in the middle column ensures your team’s efforts are always aligned with revenue and growth, not just surface-level activity.
From Data Points to Strategic Decisions
To put KPIs to work effectively, you need a simple framework that connects high-level business objectives directly to specific marketing measurements. This ensures your team isn't just busy, but is actively contributing to the bottom line.
Here’s a straightforward, step-by-step process to build this framework:
Step 1: Define Success Clearly. First, what does a win look like this quarter? Is it a 15% increase in SQLs? Or perhaps an efficiency goal, like reducing Customer Acquisition Cost (CAC) by 10%? Be specific and time-bound.
Step 2: Work Backwards. With a clear objective in place, trace back the steps that lead to it. To boost SQLs, you’ll likely need to improve the conversion rate on your "Request a Demo" page.
Step 3: Select the Right KPIs. Now you have your primary KPI: the Demo Request Conversion Rate. This is the number you’ll analyze, run experiments against, and hold your team accountable for improving.
This structured approach cuts through the noise and helps you zero in on the metrics that truly matter. It transforms marketing reports from a passive list of what you did into a strategic narrative of the results you achieved.
By focusing on the right KPI for digital marketing, you can build a more predictable growth engine, align efforts across the entire B2B sales funnel, and make confident, data-driven decisions that genuinely accelerate your company’s progress.
Mapping Your KPIs to the Marketing Funnel
A KPI is useless without context. Its real power comes from knowing where in the customer's journey you're applying it.
Trying to measure top-of-funnel traffic with a "demo request" conversion rate is like proposing on a first date. It’s the right action at the wrong time—you're asking for a commitment before building a connection.
To get a true picture of your marketing performance, you must map your KPIs to each stage of the funnel. This provides an end-to-end diagnostic of your entire marketing engine, showing you exactly what’s working, what's not, and where bottlenecks are forming. It’s the difference between guessing and knowing.
Top-of-Funnel KPIs: Building Awareness
The top of the funnel (ToFu) is about casting a wide, yet targeted, net. Your goal here isn't to make a sale; it's to get on the radar of potential customers. You're introducing your brand to people who have a problem you can solve, even if they don't know it yet.
For this stage, your metrics should be focused on reach and visibility.
Website Traffic: This foundational metric shows the total number of visits to your site. It’s crucial to segment this by source (organic, paid, social, referral) to understand which channels are effectively driving initial interest.
Impressions: This counts how many times your ads or content were displayed. While it doesn't measure engagement, a high number of impressions indicates you are achieving visibility within your target market.
Social Media Reach: This is the number of unique individuals who saw your content on social media. It offers a clearer sense of your actual audience size, moving beyond vanity metrics like likes or follows.
Strong ToFu numbers are the first sign that your message is cutting through the noise. This is where you fill the pipeline for everything that follows.
Middle-of-Funnel KPIs: Fostering Consideration
Once someone knows you exist, they enter the middle of the funnel (MoFu). This is the "evaluation" phase where they actively research, compare you to competitors, and determine if you are a credible solution. Your job is to build trust and demonstrate value.
At this stage, you're turning anonymous website visitors into known contacts. Success here isn’t just about getting clicks; it’s about the quality of the leads you’re generating.
The KPIs here become more specific, shifting from broad awareness to qualified engagement.
Lead-to-Marketing Qualified Lead (MQL) Rate: What percentage of the leads you generate actually meet your predefined criteria for a good-fit prospect? A high rate here indicates your ToFu efforts are attracting the right audience.
Cost Per Lead (CPL): How much does it cost, on average, to generate one new lead? Tracking this by channel is essential for allocating your budget to the most efficient sources.
Content Engagement Metrics: This includes metrics like ebook download rates, webinar attendance, or time spent on key blog posts. It’s proof that prospects are actively consuming your content and view you as a credible authority.
This is precisely where a solid inbound marketing strategy for B2B companies pays dividends, using helpful content to guide prospects naturally toward a decision.
Bottom-of-Funnel KPIs: Driving Conversion
Finally, we arrive at the bottom of the funnel (BoFu), where the decision is made. Your prospects have completed their research and are ready to choose a solution. Your marketing should now focus on demonstrating clear ROI and making it easy for them to say "yes".
The competition here is fierce. In Spain, for example, the digital ad market has swelled to around €5.6 billion, accounting for 56.3% of all advertising spend, according to data from IAB Spain. That’s a lot of noise to cut through at the most critical moment.
Your KPIs at this stage must be tied directly to revenue.
Conversion Rate: This is the ultimate test. What percentage of your prospects took the desired action—be it requesting a demo, starting a trial, or signing a contract?
Customer Acquisition Cost (CAC): What is the total sales and marketing cost to acquire one new customer? For a sustainable business, your CAC must be significantly lower than your Customer Lifetime Value (CLV).
Marketing-Sourced Revenue: This is the ultimate money metric. It tracks the revenue generated directly from your marketing activities, proving your team's direct impact on the company's bottom line.
By aligning your KPIs to each stage of the funnel, you move from just tracking numbers to understanding the entire story of how a stranger becomes a customer.
Essential KPIs for Every Marketing Channel
Your marketing strategy is not a single instrument but a full orchestra. Each channel—from SEO to email campaigns—plays a distinct part. To ensure they work in harmony, you must understand the unique performance language of each one. Tracking channel-specific KPIs is how you tune your efforts, ensuring every dollar spent contributes to the primary goal: driving revenue.
Without this granular view, you are essentially flying blind. You might feel your marketing is working, but you won't know why. Is SEO bringing in high-value leads, or is email marketing doing the heavy lifting? Answering these questions is the only way to optimize your budget and double down on what truly moves the needle.
This visual breaks down how different KPIs fit into the marketing funnel, from grabbing attention at the top to closing deals at the bottom.
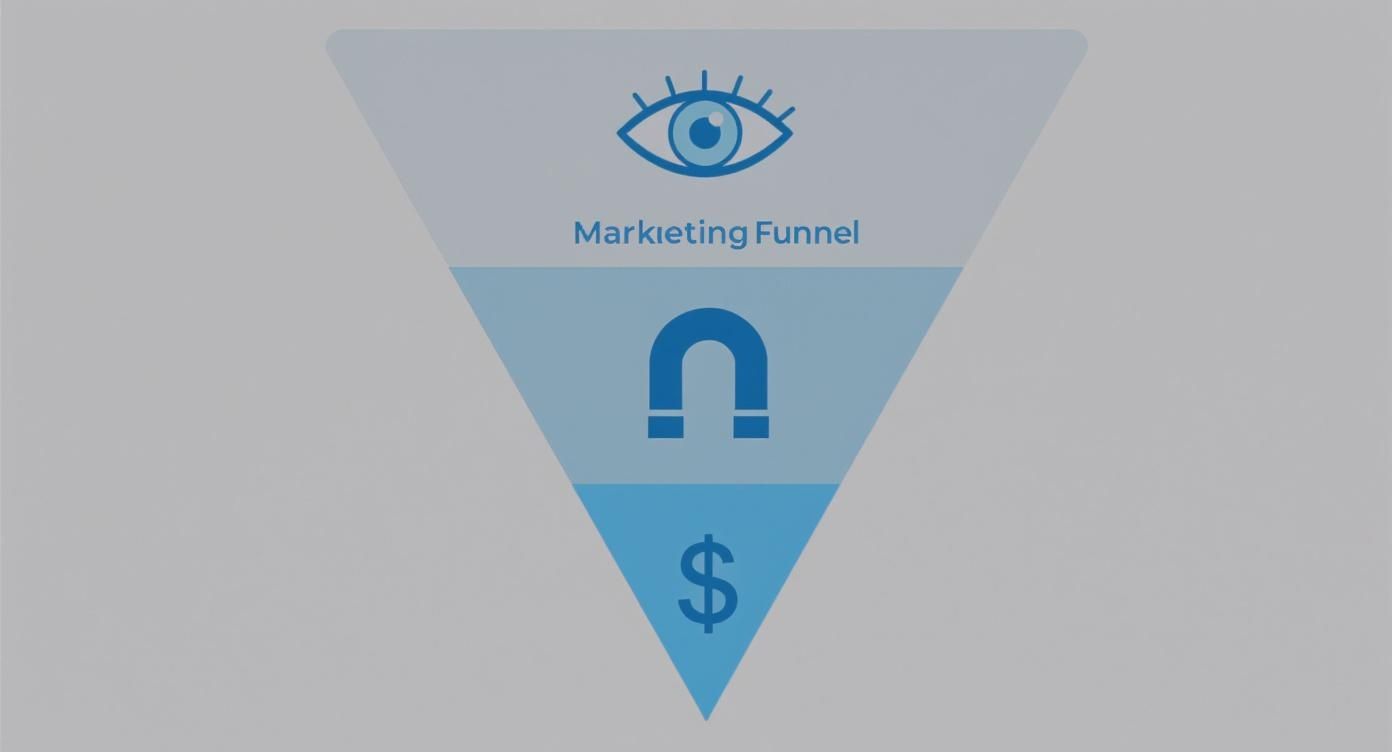
As you can see, while top-of-funnel metrics are all about reach and awareness, the KPIs at the bottom of the funnel must tie directly back to revenue.
Search Engine Optimisation (SEO) KPIs
SEO is a long-term strategy. It’s not about quick wins but about methodically building a powerful asset that generates a steady stream of qualified traffic. The right SEO KPIs tell you if you're successfully building authority and gaining visibility where it matters most.
Organic Traffic: The total number of people landing on your website from unpaid search results. A consistent upward trend is the clearest sign your SEO strategy is on the right track.
Keyword Rankings: Monitoring your position for high-intent keywords shows whether you’re capturing valuable search engine real estate. A jump in rankings for "buy now" or "get a demo" keywords almost always precedes a rise in leads.
Backlink Velocity: The rate at which other credible websites are linking to your content. A healthy, steady pace signals to search engines that your site is a trusted authority, which helps boost your overall domain rating.
Pay-Per-Click (PPC) Advertising KPIs
PPC campaigns provide instant visibility and hyper-targeted traffic, but they can quickly become a money pit without meticulous tracking. These KPIs focus on the financial efficiency of your paid efforts, ensuring every dollar spent delivers a solid return.
The ultimate goal of any PPC campaign is profitability. Clicks and impressions are important, but they mean very little if they aren't translating into a positive financial return for the business.
Here are the core metrics you must monitor:
Return on Ad Spend (ROAS): This is the king of PPC metrics. It calculates exactly how much revenue you generate for every dollar spent on ads, giving you a crystal-clear view of campaign profitability.
Cost Per Click (CPC): This tells you how much you're paying every time someone clicks your ad. Monitoring CPC helps you manage your budget and identify keywords that are too competitive or expensive to be worthwhile.
Quality Score: This is a rating (out of 10) that platforms like Google Ads assign to your keywords and ads based on their relevance and quality. A higher Quality Score is invaluable—it can lead to lower costs and better ad positions.
Social Media Marketing KPIs
Social media has evolved beyond a branding exercise; it is a powerful channel for building communities, driving engagement, and generating leads. The real challenge is connecting that activity to tangible business outcomes.
The power of social media in digital marketing is undeniable. In Spain, for example, X (formerly Twitter) is used by 25.5% of adults, giving advertisers a significant potential reach of 21.7% of the total population, according to Kepios analysis. With this level of user penetration, marketers must use specific social media KPIs to measure campaign impact.
Engagement Rate: This measures the percentage of your audience that interacts with your posts (likes, comments, shares). It’s the best indicator that your content genuinely resonates with your followers.
Social ROI: This metric connects the dots by tracking the revenue generated from your social media efforts against the investment you put in. It’s the ultimate proof that your social strategy is impacting the bottom line.
Follower Growth Rate: This tracks the speed at which you’re gaining new, relevant followers. A healthy, consistent growth rate shows your brand's reach and influence are expanding.
Email Marketing KPIs
Email remains one of the highest-ROI marketing channels. It provides a direct line to your leads and customers, and effective SaaS marketing strategies lean heavily on smart email nurture sequences to guide prospects from initial curiosity to purchase.
These KPIs help you fine-tune your messaging, improve deliverability, and maximize conversions from your subscriber list.
Open Rate: The percentage of recipients who opened your email. This is your first and most important test of your subject line's effectiveness and your brand's recognition in a crowded inbox.
Conversion Rate: This tracks the percentage of email recipients who took the desired action, such as clicking a link and then filling out a form or making a purchase.
Unsubscribe Rate: The percentage of recipients who click "unsubscribe." A sudden spike can be a red flag that your content is off-target or that your email frequency is too high.
How to Select the Right KPIs for Your Business
Selecting the right digital marketing KPIs isn't about tracking every metric available. That is a fast track to a cluttered dashboard that reports on activity but reveals nothing about results. The secret is to start with your most important business goal and work backward from there.
This simple shift in perspective changes everything. Instead of asking, "What can we measure?", you begin asking, "What must we measure to achieve our targets?" This forces every metric to justify its existence by connecting directly to revenue, sales-qualified leads, or customer loyalty.
Start With Your Primary Business Objective
Before you even look at a marketing dashboard, you need to define what success looks like. A vague goal like "grow the business" is not actionable. You need a North Star—something specific, measurable, and time-bound.
For a B2B SaaS company, a powerful objective might be:
"Increase quarterly recurring revenue by 15% in Q3."
This single sentence becomes your anchor. From this point forward, every marketing campaign and every KPI you track must answer how it contributes to hitting that 15% revenue goal. This instantly eliminates the noise from vanity metrics and aligns the entire team toward a common purpose.
Work Backward to Identify Influential KPIs
With your main objective locked in, it's time to deconstruct it. To grow revenue by 15%, what must happen? This is where you build the bridge between that high-level business outcome and the marketing performance that drives it.
Sticking with our B2B SaaS example, that revenue growth will come from either acquiring new customers or retaining existing ones. This decision immediately points you toward a set of much more specific goals and their corresponding KPIs.
Scenario 1: Focus on acquiring new customers:
Objective: We need to generate enough high-quality sales opportunities to close the revenue gap.
Leading KPI: Number of Sales-Qualified Leads (SQLs). This is the raw count of leads deemed ready for the sales team to actively pursue.
Supporting KPI: Marketing-Qualified Lead (MQL) to SQL Conversion Rate. This measures how effectively marketing is qualifying and nurturing leads for sales, serving as a crucial health metric.
Scenario 2: Focus on customer retention:
Objective: We need to reduce customer churn to protect our recurring revenue base.
Leading KPI: Customer Retention Rate. What percentage of our customers remain with us over a specific period?
Supporting KPI: Net Promoter Score (NPS). This measures customer satisfaction and loyalty, often acting as an early warning sign for potential churn.
By reverse-engineering your goal, you ensure your chosen KPIs aren't just interesting data points—they are the actual levers you can pull to move the business forward. For instance, improving your MQL to SQL rate has a direct, tangible impact on your sales pipeline, which is a cornerstone of solid sales and marketing alignment).
Map KPIs to Your Marketing Funnel
Now that you have identified your core KPIs, the final step is to connect them to the day-to-day marketing activities designed to influence them. This creates a clear line of sight from a single blog post or ad campaign all the way up to the company's highest strategic priorities.
Let’s return to our new customer acquisition goal. The path to generating more SQLs will naturally flow through your marketing funnel.
Top of Funnel (Awareness): To get more leads, we first need more of the right people visiting our site.
KPIs: Organic Search Traffic, Paid Channel Impressions.
Middle of Funnel (Consideration): Once they arrive, we need to convert that interest into a known contact with compelling content.
KPIs: Ebook Download Conversion Rate, Webinar Registration Rate.
Bottom of Funnel (Decision): Finally, we nurture those contacts until they are ready to talk to sales.
KPI: Demo Request Conversion Rate.
This tiered structure creates a cause-and-effect chain of metrics. You know that to hit your ultimate goal (SQLs), you must improve the performance of the KPIs that precede it. If your Demo Request Conversion Rate is underperforming, you know exactly where to focus your attention. This turns KPI selection from a guessing game into a repeatable, strategic process that proves marketing’s value.
Building Your Actionable KPI Dashboard
Selecting the right KPIs is only half the battle. Raw data, on its own, is just noise. An effective dashboard is what transforms those carefully chosen metrics into a strategic tool, providing a clear, compelling story about your marketing performance at a glance.
A truly great dashboard does more than just display numbers. It draws a straight line between your efforts and business outcomes, transforming abstract data points like Leads, SQLs, CAC, and LTV into a clear narrative of what’s working, what isn't, and where to focus next. This is how you stop reporting on the past and start actively shaping the future.
Core Components of a High-Impact Dashboard
To build a dashboard that drives strategy, it must be organized with purpose. Avoid the cluttered "data dump" approach. Instead, structure your visuals to answer specific business questions. Every chart and every number must have a reason for being there.
For any B2B tech company, an effective dashboard should always include these three views:
The Executive Summary: This is your top-level overview, showing only the most critical, bottom-line KPIs. It's built for the C-suite and needs to immediately answer: "Are we winning or losing?" Stick to essentials like Marketing-Sourced Revenue, Total SQLs, and Customer Acquisition Cost (CAC).
The Funnel Performance View: This section visually breaks down your marketing funnel from top to bottom. It should track conversion rates between each stage—from Visitor-to-Lead, Lead-to-MQL, and MQL-to-SQL. It’s the fastest way to spot where your process is leaking or bottlenecked.
The Channel Performance View: Here, you compare your key marketing channels side-by-side. You'll measure channel-specific KPIs like organic traffic, paid advertising ROAS, and email conversion rates to see what's really moving the needle. This view is vital for optimizing your budget and doubling down on what’s delivering the best results. For instance, you need to see the performance of your high-converting LinkedIn Ads strategies) separately from your SEO efforts to make smart adjustments.
Choosing the Right Dashboarding Tool
The tool you choose for your dashboard will depend on your budget, technical resources, and data complexity. There's no one-size-fits-all solution, so it's important to understand the trade-offs.
A popular and highly accessible choice for many teams is Google Looker Studio (formerly Data Studio). It features a user-friendly interface that makes creating interactive dashboards straightforward.
As you can see, Looker Studio has a drag-and-drop report builder and numerous data visualization options, making it a powerful free tool for marketers who need to get up and running quickly.
Here’s a quick rundown of your options:
Tool Category | Best For | Pros | Cons |
|---|---|---|---|
Spreadsheets (Google Sheets, Excel) | Start-ups and simple tracking | Free, incredibly flexible, and easy to start with. | Relies on manual data entry, prone to human error, and doesn't scale well. |
Free Data Visualisation (Google Looker Studio) | Small to mid-sized businesses | Connects to Google products seamlessly, interactive, and easy to share. | Can become slow with large datasets, and non-Google connectors are limited. |
Dedicated BI Platforms (Tableau, Power BI) | Enterprise and data-heavy teams | Extremely powerful, handles complex data with ease, and offers advanced visuals. | Expensive, requires technical expertise, and has a steep learning curve. |
From Data to Decisions: The Narrative Report
Your dashboard tells you what happened. But to be truly strategic, you need to explain the so what and the now what. This is where a narrative monthly performance report comes in. It’s the document that accompanies your dashboard, adding the critical context that numbers alone can never provide.
A dashboard shows you that a metric went down. A narrative report explains why it went down and presents a clear, data-backed plan to fix it. This is what transforms you from a data reporter into a strategic leader.
Keep your report concise and structured for impact. Here’s a simple template to follow:
Executive Summary: Start with a one-paragraph overview of the key results and takeaways from the month.
Performance vs. Goals: Show your main KPIs and how they tracked against your monthly or quarterly targets. A simple red/green color code works wonders for clarity.
Key Wins & Learnings: Highlight what went well. Just as importantly, discuss what you learned from campaigns that didn't hit their targets.
Action Plan for Next Month: Based on this month's results, outline the specific, data-driven actions you will take next.
This approach ensures your stakeholders don’t just see data; they understand what it means and trust that you have a proactive plan to keep improving. It’s the final step in making your digital marketing KPI strategy genuinely actionable.
Frequently Asked Questions (FAQ)
How often should I check my KPIs?
The ideal frequency depends on the metric's nature and your business cycle. Not every KPI needs daily monitoring; obsessing over long-term indicators can lead to reactive, poor decision-making.
A practical cadence is:
Daily/Weekly: For fast-moving campaign metrics like Cost Per Click (CPC), Click-Through Rate (CTR), and daily ad spend. These are tactical levers for immediate optimization.
Weekly/Bi-weekly: For funnel velocity metrics like new leads, Marketing Qualified Leads (MQLs), and Sales Qualified Leads (SQLs). This timeframe reveals trends without being skewed by daily fluctuations.
Monthly/Quarterly: For strategic, lagging indicators like Customer Acquisition Cost (CAC), Customer Lifetime Value (LTV), and marketing-sourced revenue. These reflect sustained effort and require a longer-term view.
What is the difference between a KPI and a metric?
This is a common point of confusion, but the distinction is critical. While every KPI is a metric, not every metric is a KPI.
A metric is any quantifiable data point you can track (e.g., website visitors, email open rates).
A KPI (Key Performance Indicator) is a metric that has been specifically chosen to measure progress toward a critical business objective (e.g., MQL-to-SQL Conversion Rate).
A KPI is inherently tied to a target and is designed to prompt action. Tracking website traffic is data collection. Using that data to measure your "Visitor-to-Lead Conversion Rate" against a quarterly goal is using a KPI.
Which KPIs should a new startup focus on first?
Startups operate with limited resources and must focus on validating their business model. Forget vanity metrics. The primary goal is finding product-market fit and a repeatable customer acquisition model.
Focus on these three foundational KPIs:
Lead Velocity Rate (LVR): The month-over-month growth in qualified leads. This is a leading indicator of future revenue and shows if demand generation is building momentum.
Customer Acquisition Cost (CAC): You must know what it costs to land a new customer. Early on, this number reveals if your go-to-market channels are economically viable.
Conversion Rate (Trial/Demo to Paid): This is the ultimate test of product-market fit. A strong conversion rate here proves that prospects find enough value in your product to pay for it.
My KPI is trending downward. What should I do?
First, don't panic. A declining KPI is a signal to investigate, not a sign of failure. Avoid knee-jerk reactions and follow a structured diagnostic process.
Confirm the Trend: Resist making immediate changes. A single bad day or week may be an anomaly. Verify that the decline is consistent over a meaningful period for that specific metric.
Isolate Variables: If your Lead-to-SQL rate dropped, what else changed simultaneously? Did a new ad campaign launch? Was the demo request form modified? Did a competitor release a new feature?
Form a Hypothesis and Test It: Create a testable theory. For example: "Our hypothesis is that the conversion rate fell because the new landing page headline isn't resonating. We will run an A/B test against the old headline to validate this." This data-driven approach turns a potential problem into a valuable learning opportunity.
Ready to stop guessing and start building a predictable revenue engine? At Haralds Gabrans Zukovs, we design and implement automated growth loops for B2B tech companies that connect every marketing action directly to pipeline and revenue. Discover how we can build your scalable growth system.